To provide the best experiences, we and our partners use technologies like cookies to store and/or access device information. Consenting to these technologies will allow us and our partners to process personal data such as browsing behavior or unique IDs on this site and show (non-) personalized ads. Not consenting or withdrawing consent, may adversely affect certain features and functions.
Click below to consent to the above or make granular choices. Your choices will be applied to this site only. You can change your settings at any time, including withdrawing your consent, by using the toggles on the Cookie Policy, or by clicking on the manage consent button at the bottom of the screen.
The technical storage or access is strictly necessary for the legitimate purpose of enabling the use of a specific service explicitly requested by the subscriber or user, or for the sole purpose of carrying out the transmission of a communication over an electronic communications network.
The technical storage or access is necessary for the legitimate purpose of storing preferences that are not requested by the subscriber or user.
The technical storage or access that is used exclusively for statistical purposes.
The technical storage or access that is used exclusively for anonymous statistical purposes. Without a subpoena, voluntary compliance on the part of your Internet Service Provider, or additional records from a third party, information stored or retrieved for this purpose alone cannot usually be used to identify you.
The technical storage or access is required to create user profiles to send advertising, or to track the user on a website or across several websites for similar marketing purposes.


thanks
What is the password to unprotect the file and edit data?
@Grant Welsh : Hi, the zip files are not protected.
Great template! I need to change the range to be 1,000,000 instead of 100. How can I do this?
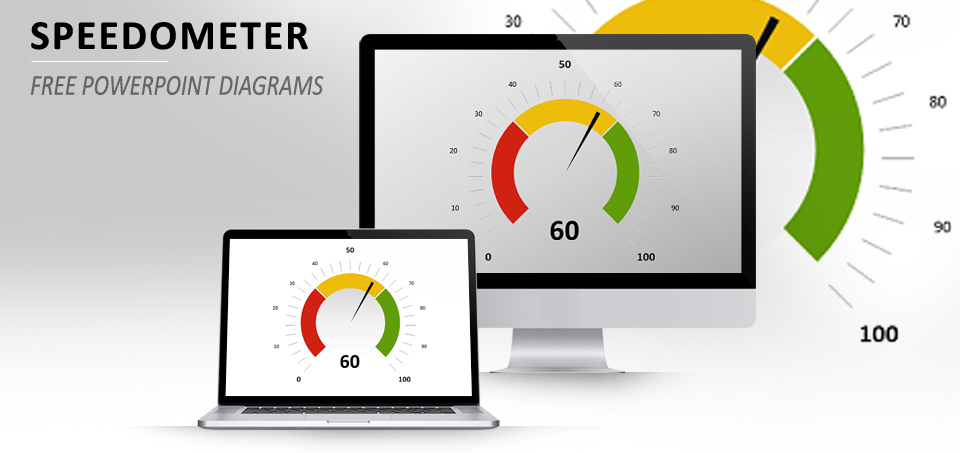
@ Lindsey: Hi, thank you for using it. Actually you can’t use it strictly using your scale. I suggest that you convert your result on a 0-100 scale (in order to have the arrow positioned correctly – as it uses relative number), and then you change yourself manually the scale on the diagram (the numbers 0, 10, 20, etc. are text boxes, and not built-in the graph). The same way you can manually force your own final result (on a 0-1,000,000 scale) on the box below the graph…
Thank you!!
how do I change the color scale? for example say I want 0 thru 50 to be red and 50 thru 100 to be green
@Mike : You can’t do this very easily: the 3 colors you see are actually 3 different shapes arranged back to the data-driven chart. To get what you need, you’d have to re-design these shapes.