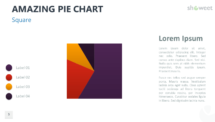
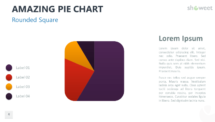
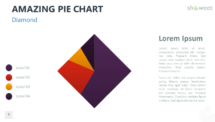
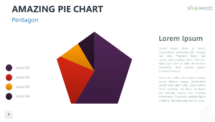
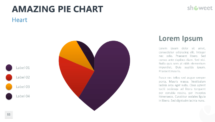
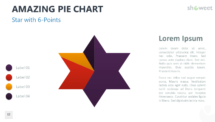
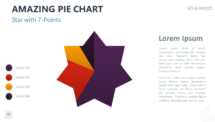
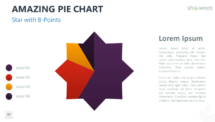
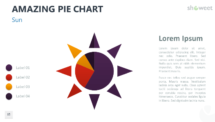
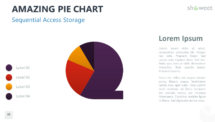
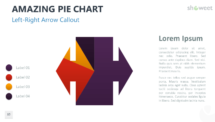
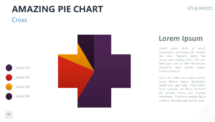
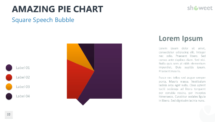
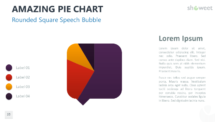
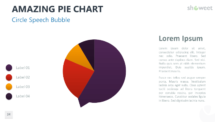
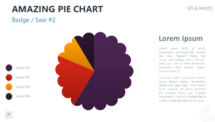
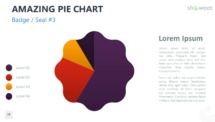
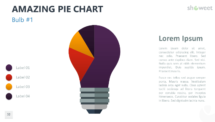
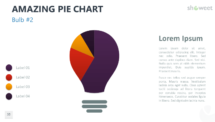
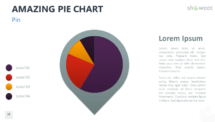
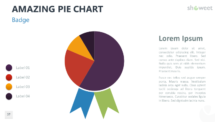
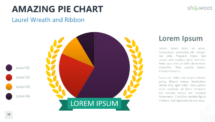
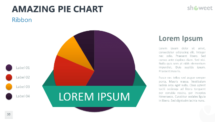
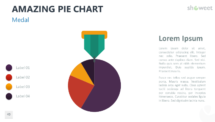
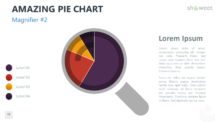
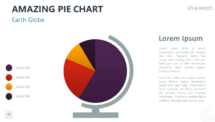
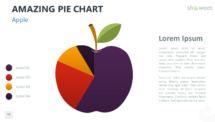
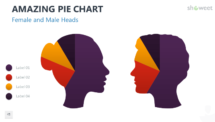
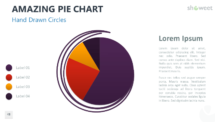
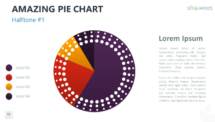
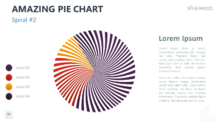
Show-off your data with this free collection of amazing pie-charts for your PowerPoint presentations. Ready and easy-to-use.
Pie-charts are widely used in reports or presentations to illustrate numerical proportion.
Pie-charts are (always) circular graphics… but now you can present your (pie-chart) data in an extra-ordinary way!
This selection of 50 custom-made amazing pie-charts with completely editable creative graphics and text placeholders will surely hold your audience’s attention.
2 size layouts are available for your convenience: standard (4:3 screen ratio) and widescreen (16:9).
The document Amazing Pie Charts 2 for PowerPoint’ features:
- 50 pre-designed unique, clean and professional slides
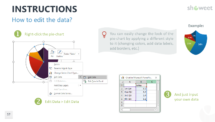
- Fully editable content (graphics and text) via PowerPoint – No Photoshop needed!
- Aspect ratios: Standard (4:3), Widescreen (16:9)
- Format: PowerPoint (.PPTX) – created with PowerPoint 2016
- License: Free – Attribution (please read carefully the ‘Terms of Use‘ before using this template, restrictions may apply)
Free fonts used:
- Calibri (System font)
- Arial (System font)























Idea is interesting, readability not so…
Hey Franck, thanks for your honest review… as always, very much appreciated!
its cool chart with mindblowing idea. thanks or sharing
Ustedes son lo máximo. Muchas gracias. Me han ahorrado horas de trabajo. Los amo.
trop cool
thanks you