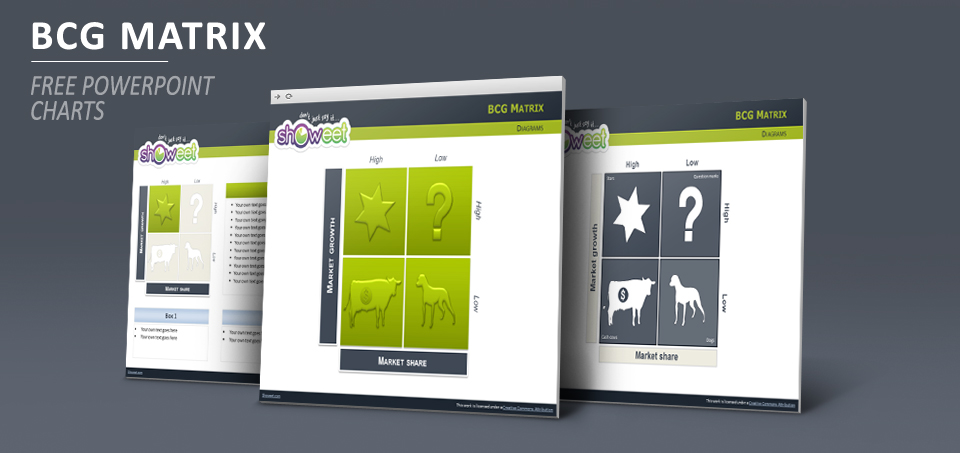
Free professional BCG Matrix Charts for PowerPoint. Includes 14 high quality slides with editable (easily customizable) graphics.
The BCG Matrix is very widely used marketing technique to illustrate how a portfolio of products should be diversified and well-balanced.
The matrix chart, a scatter plot graph is used to rank the business units (or products) on the basis of their relative market shares and growth rates and positive or negative cash flow. This framework categorizes products within a company’s portfolio as stars, cash cows, dogs, or question marks.
- Stars: high market share and high growth products
- Cash cows: high market share and slow growth
- Question marks: low market share, high growth products
- Dogs (or pets): low market share and slow growth
Presentation Package includes:
- 14 slides
- Editable graphics (to easily customize colors and size)
- Placeholder text for your own text and descriptions.
- Format(s) available: optimized for PowerPoint 2007-2013 (.PPTX)
- Licence: Attribution-NoDerivs 3.0 Unported (CC BY-ND 3.0)


Really useful for the marketing and management students.
Great material
I’d appreciate giving free
If you need help translating to Spanish feel free to contact, I’d help
@Boni : Hi Boni, thank you very much, that is very kind of you. We are actually translating it to Spanish (and French). Should you have any comments on translations (when released), do not hesitate (very much appreciated!). Thanks again!
Thank you, it is very amazing, helpfull and meaningful ideas
Thank you v much for the helpful information
May God bless u
Awesome stuff!!! Thank you for been so generous!! God Bless!!!
would really recommend this site, the items are made of quality and have rich content. Making it free helps many folks take advantage in a positive way. Any contributions required or localization, please reach out. Great Job!
@Venkat: Hi Venkat, thank you very much! That’s the kind of comment that makes us feel very happy and proud…