Charts & diagrams
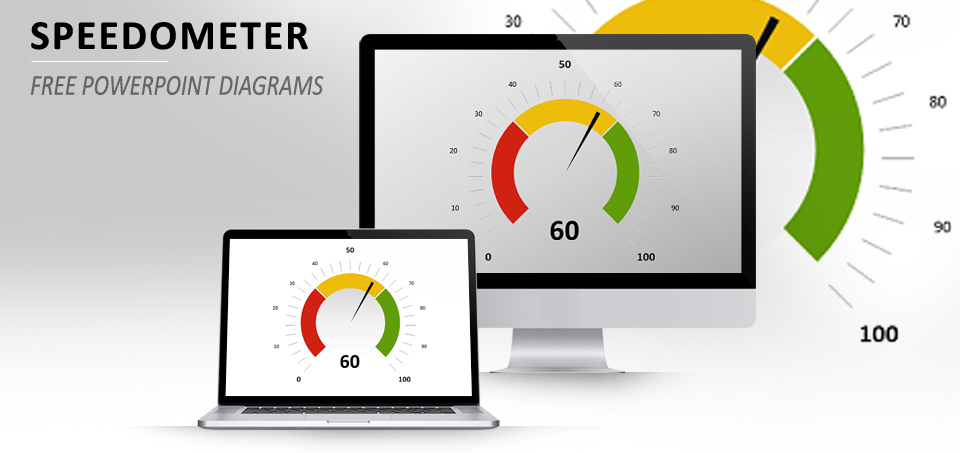
Speedometer 4 – Free Diagram for PowerPoint
Yet another free data-driven speedometer for PowerPoint. Great to be used for visual presentation of performance measures on a 0-100 scale.
Creative and free PowerPoint templates
Browse our extensive collection of charts and diagrams for Google Slides and PowerPoint. 100% free downloads.
Editable, easily customizable, and professional graphics.
Yet another free data-driven speedometer for PowerPoint. Great to be used for visual presentation of performance measures on a 0-100 scale.
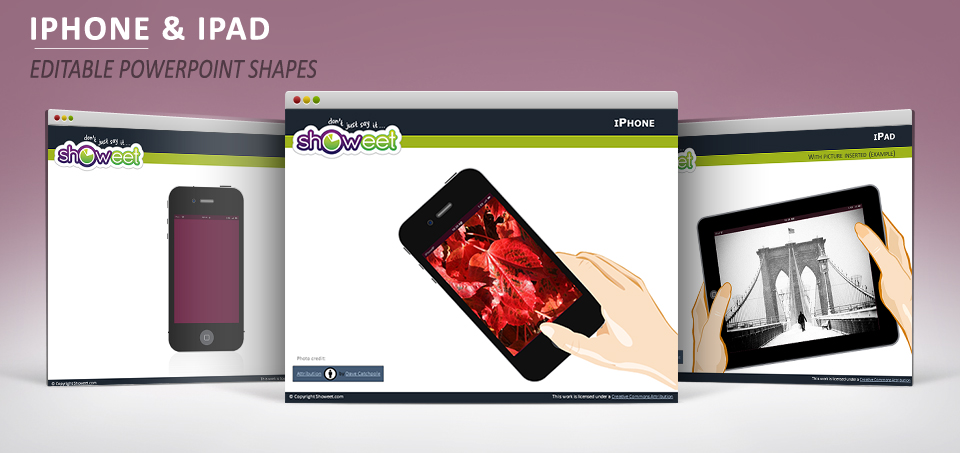
Free editable (vector) illustrations of the Apple iPhone and iPad for PowerPoint. Contains 6 slides with the single device designs, hold hand, and examples with inserted photo.
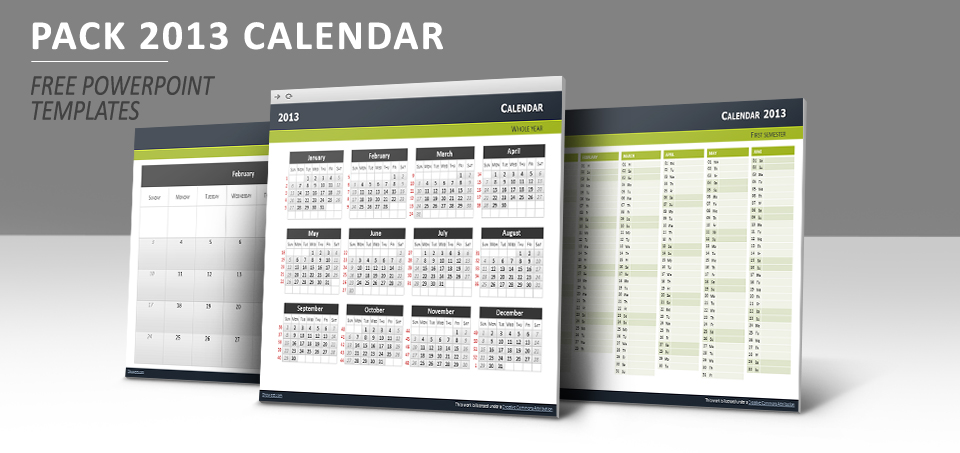
Free set of various calendar 2013 templates for PowerPoint. Includes 20 slides, with different calendar layouts to fit any of your presentations: overview of the full 2013 year, semesters or single month focus, to subtle single month banners.
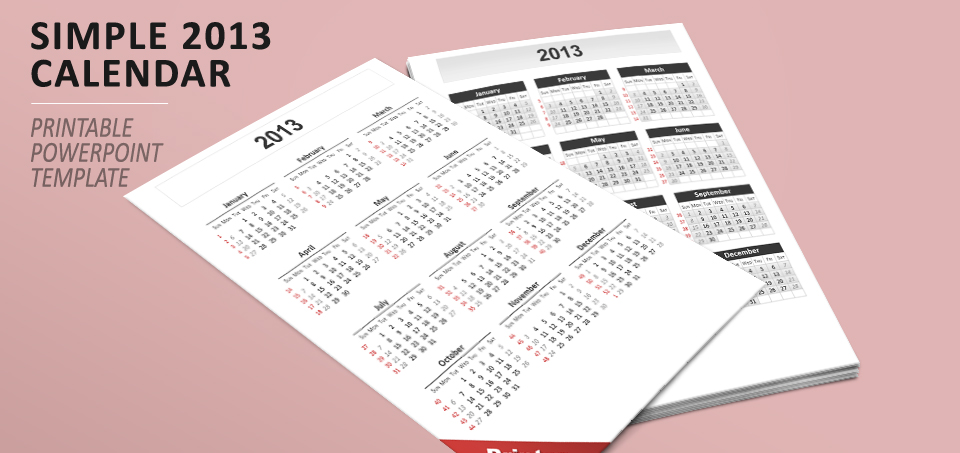
Free printable calendar 2013 template for PowerPoint. Portait layout, with 12 months overview. Includes a printer friendly page.
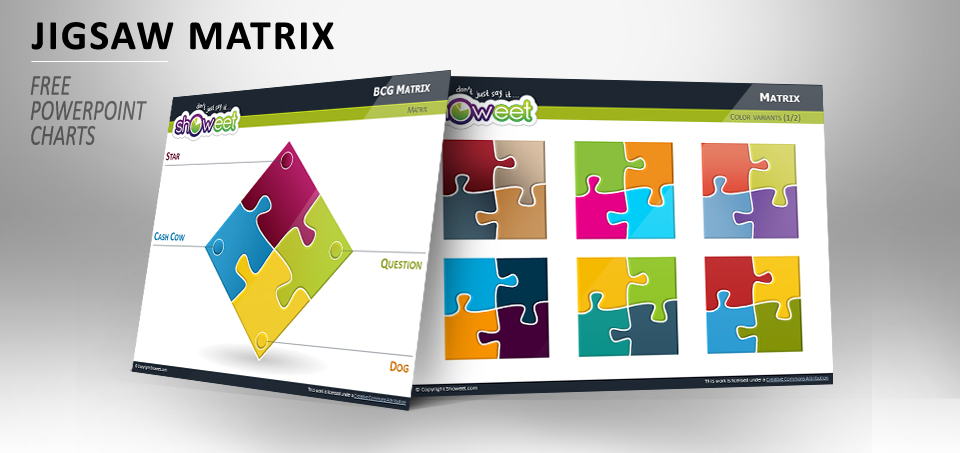
Showeet’s back with this free 2×2 matrices with jigsaw puzzle pieces for PowerPoint. Fully editable shapes. With examples for SWOT Analysis, BCG or 4-P marketing mix matrix. Also released with different color-schemes.
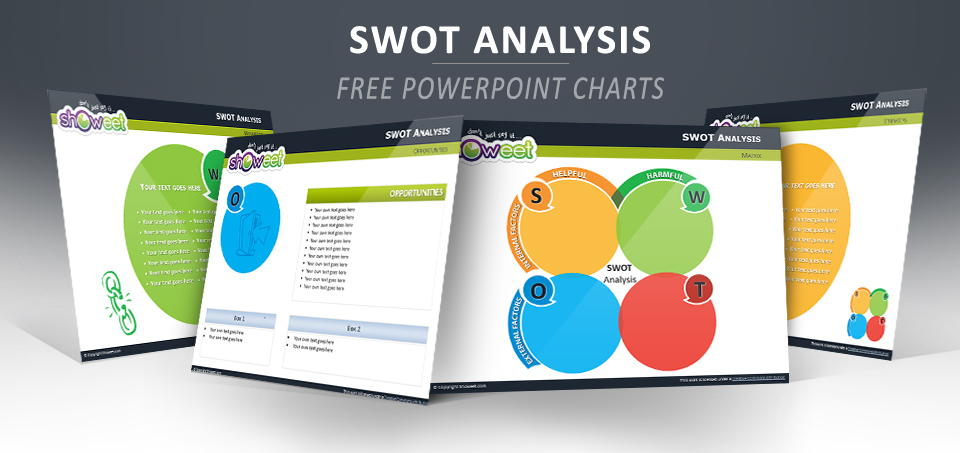
Third variant of free SWOT analysis template for PowerPoint. Creative design with round shapes for the four quadrants of the matrix.

Rounded square mosaic layer effect for photos in PowerPoint. Use this free and easy to use layer to create special effects for the photos you use in your PowerPoint presentations.
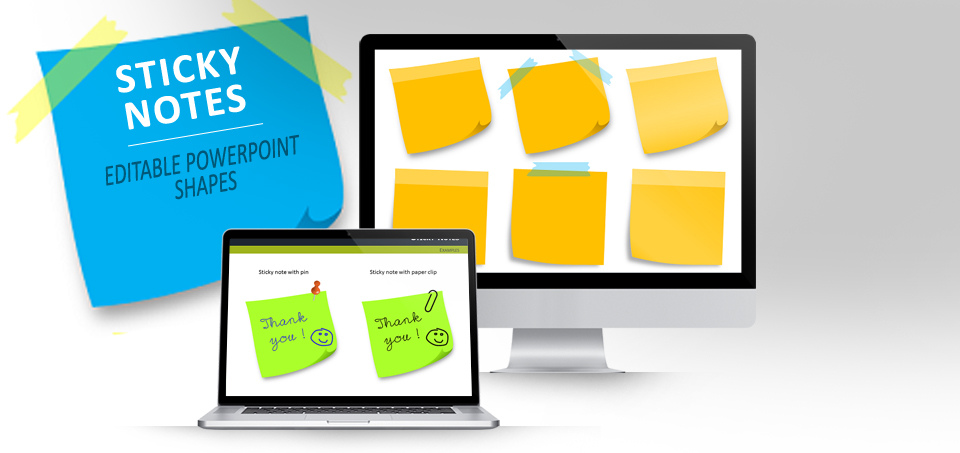
Free set of fully editable sticky notes in different colors. Comes also with editable adhesive tape and pin collection.