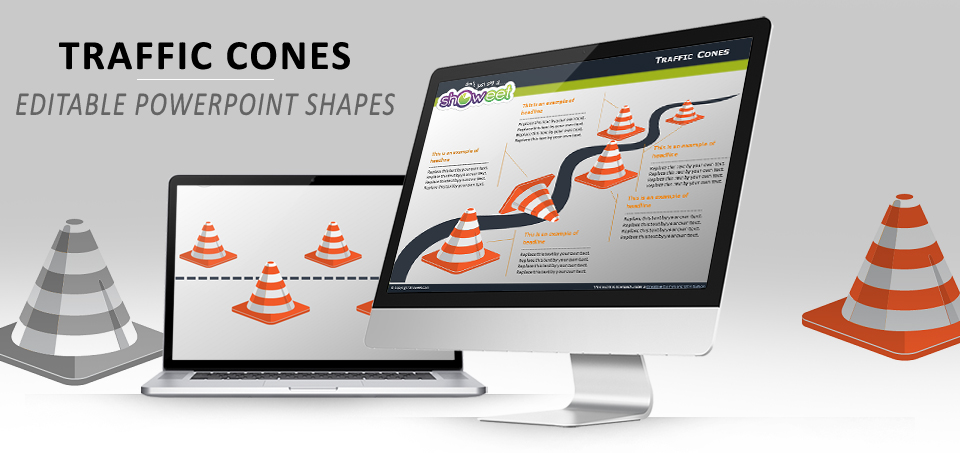
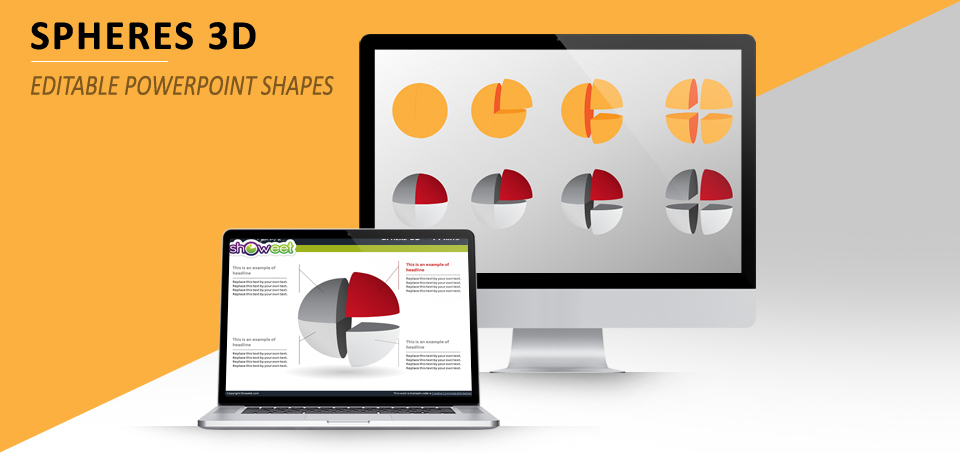
Iceberg PowerPoint charts

Charts & diagrams

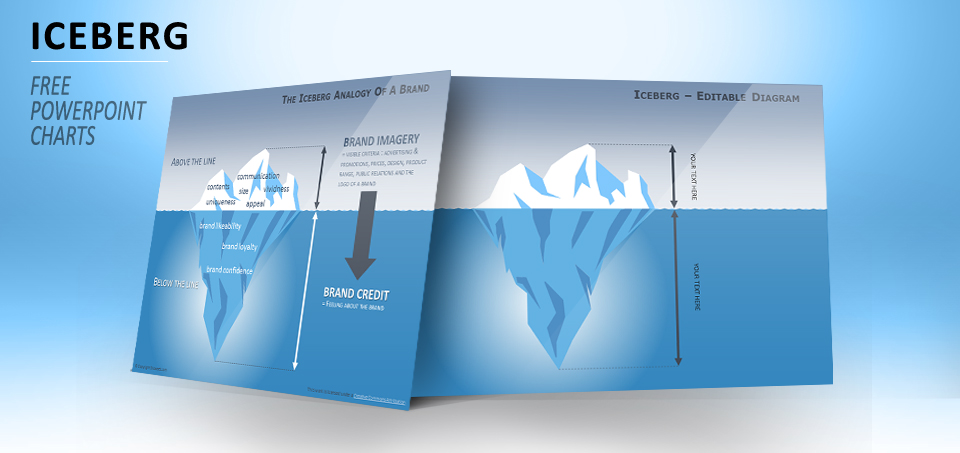
Iceberg Diagram for PowerPoint

Free iceberg diagram for PowerPoint. Used in various fields (marketing, management, psychology, human resources, finance) the iceberg model is an analogy that allows to illustrate opposite or dual concepts. Includes 3 slides, with editable shapes and with 2 concrete examples: “The iceberg model of meaning”, and “The iceberg analogy of a brand”

Circle sphere diagrams for PowerPoint

Charts & diagrams

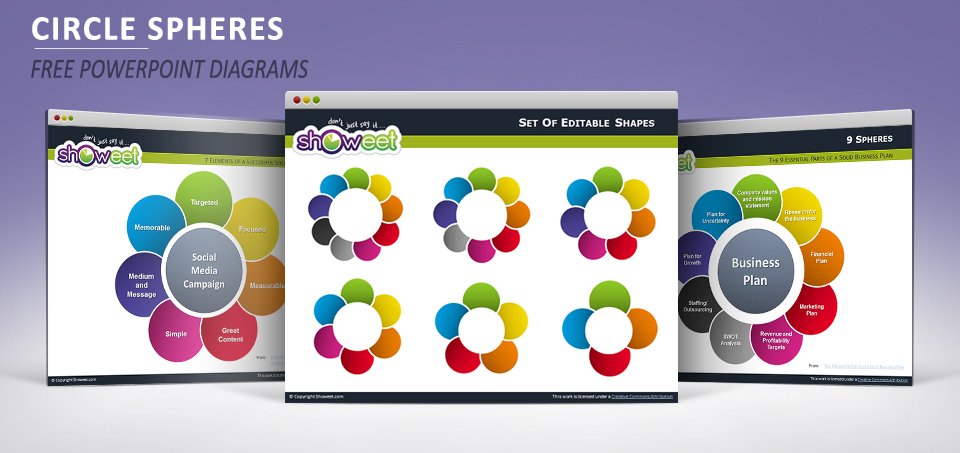
Circle Spheres Diagrams For PowerPoint

Free circle spheres for PowerPoint. Pre-designed diagrams made of 9 to 4 fully editable shapes. Also known as radial diagrams or even Venn diagrams, the use of these overlapping spheres is great to illustrate a Process Cycle, or the main elements of a strategic model.